How to Easily Calculate IQR in Excel: A Quick Guide

Understanding the Interquartile Range (IQR)
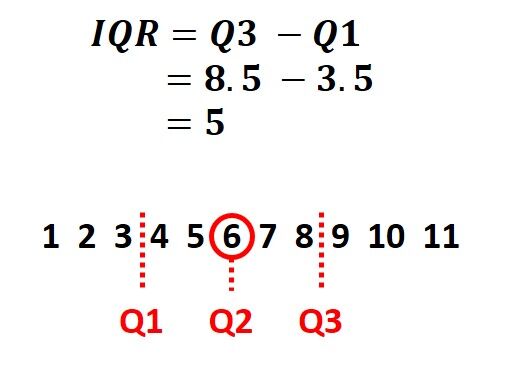
Before diving into how to calculate the Interquartile Range (IQR) in Excel, it's important to understand what IQR represents. The IQR measures variability by calculating the difference between the third quartile (Q3) and the first quartile (Q1) in a dataset. It shows how spread out the central 50% of the data is, excluding any outliers.
Why is IQR Important?
- Robustness to Outliers: Unlike the range, which uses only the extreme values, IQR is less affected by outliers.
- Useful in Box Plots: IQR is key in constructing box plots, providing visual cues about data distribution.
- Identifying Outliers: It helps in determining what might be considered outliers in a dataset.
Steps to Calculate IQR in Excel
1. Arrange Your Data
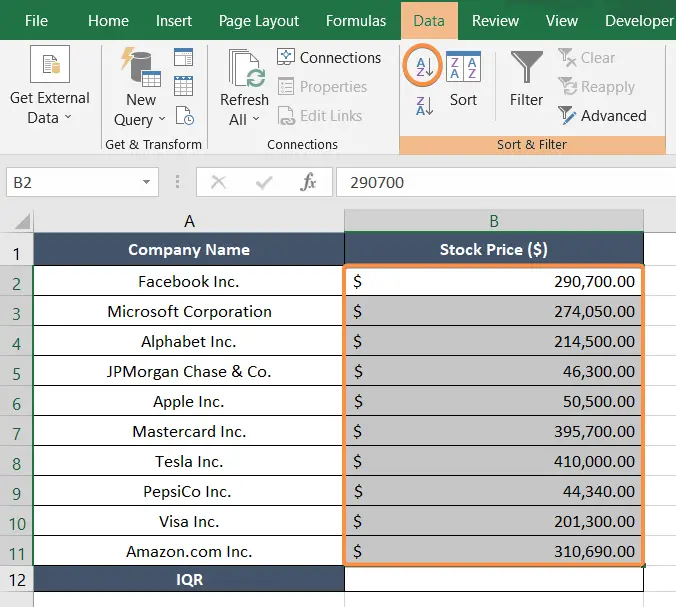
First, ensure your data is in a single column or row. For clarity, we’ll assume the data is in column A:
    A
1.  Value1
2.  Value2
3.  Value3
   …
n.  ValueN
2. Calculate the First Quartile (Q1)
Use Excel’s QUARTILE function to find Q1:
=QUARTILE(A1:A10, 1)
📌 Note: Ensure your dataset does not have gaps or missing values when using QUARTILE.
3. Calculate the Third Quartile (Q3)
Now, find Q3 using the same function:
=QUARTILE(A1:A10, 3)
4. Compute the IQR
To find the IQR, subtract Q1 from Q3:
=Q3 - Q1

| Step | Formula | Result |
|---|---|---|
| First Quartile (Q1) | =QUARTILE(A1:A10, 1) |
ValueX |
| Third Quartile (Q3) | =QUARTILE(A1:A10, 3) |
ValueY |
| IQR | =Q3 - Q1 |
ValueY - ValueX |
🌟 Note: Excel versions might differ in how they calculate QUARTILE. For newer versions, use QUARTILE.EXC for exclusive quartiles or QUARTILE.INC for inclusive quartiles.
Additional Considerations
- Sorting Data: While not mandatory, sorting your data can make it easier to understand the spread visually.
- Handling Outliers: IQR can be used to identify outliers. Any data point below Q1 - 1.5 * IQR or above Q3 + 1.5 * IQR can be considered an outlier.
- Alternative Methods: If you are using an older version of Excel, you might need to use PERCENTILE instead of QUARTILE functions.
Wrapping Up
The Interquartile Range is an essential statistical tool to measure variability within your dataset. With Excel’s QUARTILE functions, you can quickly calculate IQR, providing insights into data spread and helping in tasks like creating box plots or detecting outliers. By following the steps outlined above, you can easily compute IQR and enhance your data analysis skills.
What is the difference between inclusive and exclusive quartiles?
+Inclusive quartiles (QUARTILE.INC) include all data points when calculating quartiles, whereas exclusive quartiles (QUARTILE.EXC) exclude a portion of the data to avoid including the extreme values in the calculation. This can slightly alter the calculated quartiles.
Can IQR be negative?
+No, the IQR cannot be negative since it’s calculated by subtracting Q1 from Q3, where Q3 is always greater than or equal to Q1.
How do I handle missing values in the dataset?
+Missing values should be removed or filled in before calculating IQR. Excel will not include empty cells or non-numeric values in its calculations, potentially leading to inaccurate results if not addressed.


