Mastering Median Absolute Deviation in Excel Quickly

If you've worked with data or statistics, you've probably encountered various measures of dispersion like standard deviation and variance. However, a lesser-known but equally powerful tool is the Median Absolute Deviation (MAD). This measure provides a robust way to assess variability in your dataset, especially when dealing with outliers or skewed distributions. In this blog, we will explore how to calculate the Median Absolute Deviation in Microsoft Excel efficiently.
Understanding Median Absolute Deviation
Before diving into Excel techniques, let's briefly cover what the Median Absolute Deviation is and why it's useful:
- Robustness: Unlike standard deviation, MAD is not heavily influenced by outliers, making it a more reliable measure of dispersion for datasets with anomalies.
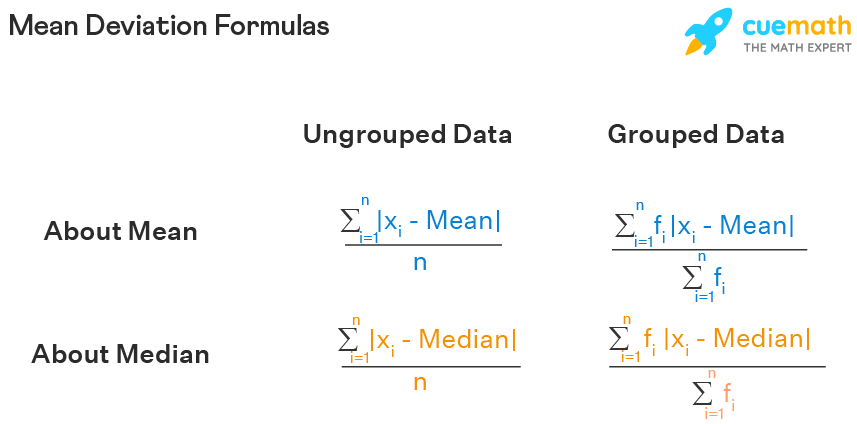
- Calculation: MAD calculates the median of the absolute deviations from the dataset's median.
- Applications: It's widely used in statistical analysis, data science, financial analysis, and quality control where robustness against extreme values is crucial.
Step-by-Step Guide to Calculating MAD in Excel
1. Preparing Your Data
Start by ensuring your data is well-organized in an Excel sheet. Here’s how:
- Select an empty column next to your data or a new sheet for calculations.
- Copy your dataset if needed or reference it directly.
2. Calculate the Median
To find the median:
- Select a cell and enter the formula:
=MEDIAN(A2:A20)
where A2:A20 represents the range of your data. - Press Enter to get the median value.
3. Compute Absolute Deviations
To calculate the absolute deviation from the median:
- In the cell adjacent to your first data point, enter:
=ABS(A2 - B2)Here, A2 is your data point and B2 is the cell with the median. - Drag the formula down to apply it to all data points.
4. Find the Median of Absolute Deviations
This step involves:
- Use another empty cell to find the MAD:
=MEDIAN(C2:C20)
where C2:C20 contains the absolute deviations from Step 3.
📢 Note: Remember to adjust cell references according to your dataset's location.
5. Calculate the Normalized MAD (optional)
To normalize the MAD:
- Multiply by 1.4826, which is a factor that makes the MAD equivalent to the standard deviation in a normally distributed dataset:
=D2 * 1.4826
where D2 contains the MAD from Step 4.
The following table summarizes these steps:

| Step | Description | Formula |
|---|---|---|
| 1 | Prepare Data | N/A |
| 2 | Find Median | =MEDIAN(A2:A20) |
| 3 | Absolute Deviations | =ABS(A2 - $B$2) |
| 4 | MAD Calculation | =MEDIAN(C2:C20) |
| 5 | Normalize (optional) | =D2 * 1.4826 |
Key Takeaways and Practical Usage
The Median Absolute Deviation provides an alternative to standard deviation when dealing with:
- Non-normal distributions
- Data with potential outliers
- Need for a measure less sensitive to extreme values
Here are some ways you can use MAD:
- Data Cleaning: Identify and possibly remove or adjust outliers.
- Robust Modeling: Use it in statistical models where standard deviation might not be appropriate.
- Comparative Analysis: Compare the dispersion between groups where the distribution properties are unknown or varied.
💡 Note: While MAD is useful, it's not a replacement for all uses of standard deviation, especially in cases where the assumption of normality holds.
Excel has made this complex calculation accessible to everyone by providing the necessary functions to compute MAD. Mastering the use of these functions not only enhances your Excel proficiency but also allows for deeper insights into your data's behavior.
What makes MAD better than standard deviation in some cases?
+MAD is less affected by outliers and extreme values, making it a robust choice for skewed distributions or when the dataset contains anomalies.
How do you normalize MAD?
+Normalize MAD by multiplying the calculated MAD by 1.4826, which adjusts it to a similar scale as the standard deviation in a normal distribution.
Is MAD suitable for all datasets?
+No, MAD is particularly useful when dealing with skewed distributions or when outliers significantly affect the data. For normally distributed datasets, standard deviation might be more appropriate.
Can I use Excel for calculating MAD without additional tools?
+Absolutely! Excel’s built-in functions like MEDIAN and ABS are all you need to compute MAD quickly and efficiently.
What are the limitations of using MAD in data analysis?
+MAD might not provide the best measure of variability for symmetric distributions with minor outliers, as it does not consider all data points equally in its calculation.
With these steps and insights, you are well-equipped to leverage the Median Absolute Deviation in Excel to enhance your data analysis, ensuring that your findings are both robust and meaningful, regardless of the nature of your dataset.


