Create a Run Chart in Excel Easily

Introduction to Run Charts
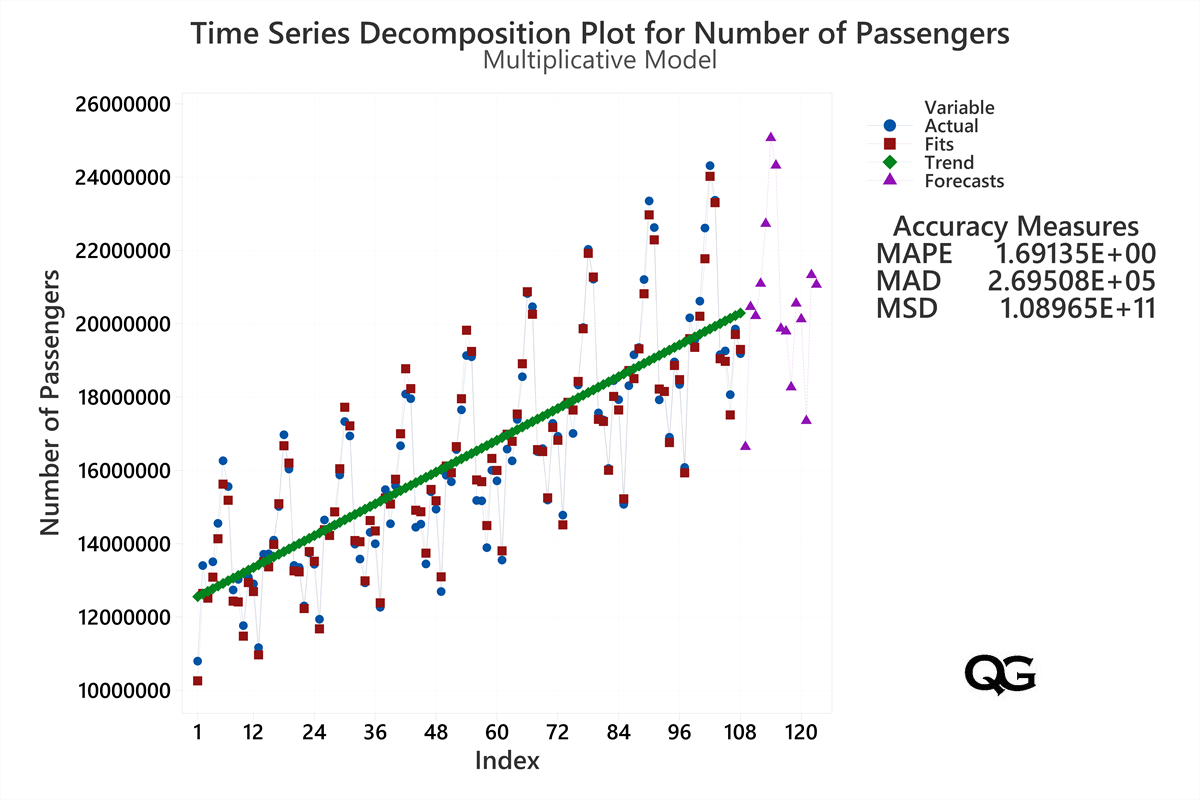
Run charts are powerful tools for monitoring process performance over time, allowing organizations to identify trends, shifts, and patterns that may not be immediately visible from tabular data alone. Essentially, a run chart plots data in the sequence it occurs, providing insights into process stability, improvement, or deterioration. With applications ranging from manufacturing to healthcare, creating a run chart can be done easily using Microsoft Excel.
Step-by-Step Guide to Creating a Run Chart in Excel
Follow these steps to construct your run chart:
- Prepare Your Data
Begin by organizing your data in Excel. Your dataset should include:
- A column for the time period (e.g., dates, timestamps, or index values)
- A column for the variable you want to track
- Insert Your Data into Excel
Input your time period in one column and the corresponding values in the adjacent column:

Time Variable Jan-21 50 Feb-21 55 Mar-21 52 - Create a Basic Line Chart
- Select the entire range of data (including headers)
- Go to the 'Insert' tab and select 'Line Chart' under 'Charts'
- Format Your Chart
- Right-click the chart and select 'Select Data'
- Ensure the 'Time' column is set as the horizontal (category) axis labels
- Remove any series that aren't relevant to the variable you're tracking
- Add Chart Elements
- Click the green plus sign ('+') on the top right of the chart
- Add 'Axis Titles', 'Chart Title', 'Gridlines', and 'Legend' as needed
- Adjust the format of these elements to make your chart more readable
- Enhance With Reference Lines
- To add a median line or other reference lines:
- Right-click on the chart, choose 'Select Data'
- Add a new series for the median line
- Use the same 'Time' data for the x-axis but enter the median value for all y-axis values
- Format this series with a dashed line for better distinction
- To add a median line or other reference lines:
- Final Touches
- Adjust the scale of the y-axis if necessary
- Add data labels if you want to highlight specific points
- Use 'Format Chart Area' to refine appearance like background colors
💡 Note: When adding reference lines, ensure they are visually distinct from the main line to avoid confusion. This can be done by adjusting line style and color.
Interpreting Your Run Chart
Once your run chart is set up, here’s how to interpret the data:
- Trends: Look for consistent upward or downward movements which indicate improvement or degradation.
- Shifts: A series of points clustering above or below the median could suggest a significant shift in the process.
- Cycles: Regular patterns in data might suggest periodicity or cycles in the process performance.
📈 Note: Consider run rules like six consecutive points increasing or decreasing, or eight points on one side of the median, to identify non-random patterns.
In closing, run charts are essential for organizations looking to continuously improve their processes. They offer a simple yet effective way to visualize data, making trends and anomalies immediately apparent. By following this guide, you can easily create run charts in Excel, providing valuable insights into your processes. This tool not only aids in spotting potential areas for improvement but also in monitoring the effectiveness of changes made.
What types of data are suitable for a run chart?
+
Run charts are particularly useful for continuous data like time, weight, temperature, or sales figures. They can also work with categorical data when plotted in a sequential manner.
How do you determine if a trend is significant?
+
A trend can be considered significant if there’s a clear and consistent pattern over time, such as six or more consecutive points trending in one direction. Additionally, statistical tests can be used to confirm the significance.
Can run charts be used for real-time monitoring?
+
Yes, run charts can be updated in real-time by incorporating new data points. This makes them ideal for monitoring ongoing processes where frequent updates are necessary.
Related Terms:
- Run chart in Excel template
- Run Chart generator
- Run Chart Template
- run sheet template excel
- run chart excel template
- example of a run chart


