Mastering Uncertainty Calculation in Excel: Your Ultimate Guide

Excel's ability to handle numerical data extends far beyond simple calculations; it offers robust tools for statistical analysis, one of which is the calculation of uncertainty. Understanding uncertainty in your data not only improves decision-making processes but also provides a clearer picture of your data's reliability. This guide will walk you through mastering uncertainty calculations in Excel.
Understanding Uncertainty
Before delving into the methods of calculating uncertainty, it’s vital to grasp what uncertainty actually represents in data analysis:
- Definition: Uncertainty refers to the range within which the true value of a measurement might lie. It accounts for both systematic and random errors.
- Why it matters: Decision-making in any field from science to finance requires understanding the potential errors in your data to make informed choices.
🧪 Note: Uncertainty does not reflect mistakes but rather our level of confidence in the measurement or calculation.
Calculating Basic Statistical Measures
To quantify uncertainty, first, you need to gather some statistical information about your data:
- Mean: This is the average of all values in your dataset.
- Standard Deviation: A measure of the dispersion of a dataset relative to its mean.
- Variance: The average of the squared differences from the Mean.
You can use Excel’s functions:

| Measure | Excel Function |
|---|---|
| Mean | =AVERAGE(range) |
| Standard Deviation | =STDEV(range) or =STDEV.P(range) for population |
| Variance | =VAR(range) or =VAR.P(range) for population |
Confidence Intervals and Error Bars
Excel can generate confidence intervals to visually represent the uncertainty around your estimates:
- Confidence Intervals: Use the
=CONFIDENCE.NORM(alpha, standard_dev, size)for normally distributed data or=CONFIDENCE.T(alpha, standard_dev, size)for a t-distribution. - Error Bars: Add them to charts for a visual representation of uncertainty.
📊 Note: The choice between normal and t-distribution depends on your sample size and knowledge of the population variance.
Propagating Uncertainties
When you manipulate data with uncertainty, you propagate that uncertainty through the calculation. Here are some common rules:
- If you are adding or subtracting quantities with uncertainty, add the uncertainties in quadrature (e.g., if A±A_error + B±B_error = C±C_error, then C_error = sqrt(A_error^2 + B_error^2)).
- For multiplication or division, the relative errors (error/mean) should be added in quadrature.
🧐 Note: Excel doesn’t have built-in functions for uncertainty propagation, but you can construct the formulas using basic Excel functions.
Working with Multiple Sources of Uncertainty
When dealing with multiple sources:
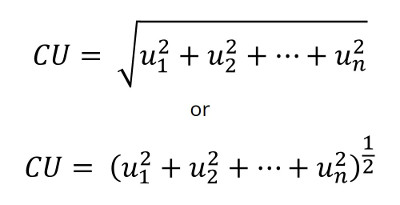
- Combined Uncertainty: Combine individual uncertainties using the root sum square method.
- Correlation: If the sources are correlated, the formula needs adjustment for the correlation coefficient.
Advanced Techniques
For more sophisticated analysis:
- Monte Carlo Simulation: Generate numerous random samples based on your data distributions to model uncertainty outcomes.
- Regression Analysis: Use Excel’s regression tools to understand how changes in predictor variables affect the outcome variable, including uncertainty in the model.
In summary, mastering uncertainty calculations in Excel can significantly enhance your data analysis skills, enabling you to make more robust decisions with a clearer understanding of data reliability. Whether you're forecasting financial trends, analyzing scientific data, or optimizing business processes, the ability to quantify uncertainty is crucial. Applying these techniques allows for a more nuanced and credible approach to your work, ensuring that you account for potential errors in your measurements and calculations.
What’s the difference between confidence and uncertainty?
+Confidence intervals are a way to express the uncertainty of an estimate. While confidence gives you a range where you expect the true value to fall with a certain probability, uncertainty addresses the variability or error in that estimate itself.
How do I decide between normal and t-distribution for my data?
+If your sample size is small (less than 30) and the population variance is unknown, use the t-distribution. For larger samples or when the population variance is known, use the normal distribution.
Can I use Excel for uncertainty propagation?
+Excel does not have built-in functions for propagating uncertainty, but you can manually apply the rules for propagation using standard Excel operations.
What should I do if my data sources are correlated?
+When data sources are correlated, you need to account for the correlation coefficient when calculating combined uncertainty.
Related Terms:
- how to calculate uncertainty formula
- formula to find uncertainty
- calculate measurement uncertainty in excel
- how to calculate mean uncertainty
- uncertainty calculator excel free download
- sample uncertainty calculation


