Calculate P-Value in Excel: Simple Steps

Understanding p-values is critical in statistical analysis, especially when you're trying to determine if there's a statistically significant difference between data sets. Excel is a powerful tool for this purpose, making statistical calculations accessible even to those without extensive programming skills. In this post, we'll explore how you can calculate p-values in Excel with ease.
Understanding P-Values
A p-value is a probability that measures the evidence against a null hypothesis. In simpler terms, it tells you:
- How likely it is to observe your data if the null hypothesis were true.
- Whether your results are due to chance or if there's a real effect.
🔬 Note: A low p-value (typically less than 0.05) indicates strong evidence against the null hypothesis, suggesting statistical significance.
When Do You Need to Calculate P-Values?
You'll need to calculate p-values when:
- Comparing groups (e.g., between treatments or different populations).
- Assessing the strength of a relationship in regression analysis.
- Testing hypotheses about mean differences.
Calculating P-Values in Excel
Here's how you can calculate p-values using Excel:
Using T-Tests
If you're comparing means, a T-test is a straightforward approach:
- Input Data: Organize your data into two columns, one for each group you're comparing.
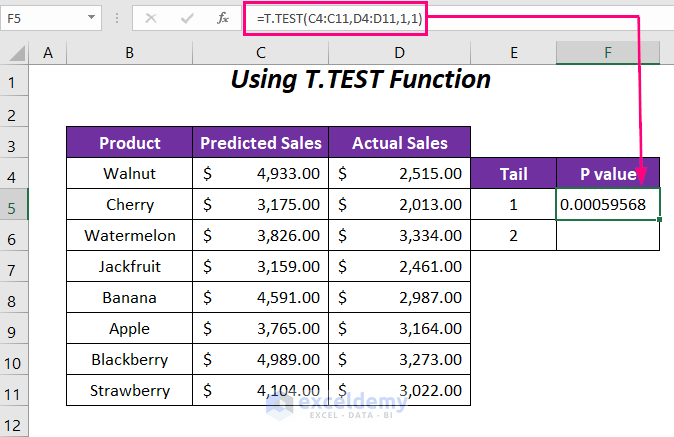
- Formula: Use the following formula for an independent two-sample T-test:
```T.TEST(array1, array2, tails, type)```
- array1 and array2 are your two data sets.
- tails is the number of distribution tails (1 or 2).
- type specifies the type of T-test (1 for paired, 2 for two-sample equal variance, 3 for two-sample unequal variance).
- Interpret Results: The p-value returned tells you whether the difference between the means is statistically significant.
Example:

| Group A | Group B |
|---|---|
| 45 | 30 |
| 30 | 50 |
| 25 | 60 |
To calculate the p-value for an independent two-sample T-test with unequal variance:
=T.TEST(A1:A3,B1:B3,2,3)
⚙️ Note: This formula returns a two-tailed p-value. Remember to choose the appropriate tail number and type of T-test for your analysis.
Chi-Square Test
The Chi-Square test is used for:
- Analyzing categorical data.
- Comparing proportions.
Here’s how to do it:
- Input Data: Arrange your data in a contingency table.
- Formula: Use `CHISQ.TEST(observed range, expected range)`.
- observed range is your actual data.
- expected range can be calculated or inputted manually.
- Interpret Results: A small p-value indicates that the differences in proportions are not due to chance.
Regression Analysis
Excel's `Analysis ToolPak` can perform regression analysis:
- Add ToolPak: Go to "File" > "Options" > "Add-ins", select "Excel Add-ins", and add the Analysis ToolPak.
- Regression: Use the "Data" tab, then "Data Analysis" > "Regression".
- Results: Look for the p-value in the output, which will be associated with each independent variable.
Wrapping Up
By mastering the process of calculating p-values in Excel, you enhance your ability to make data-driven decisions in various fields. Excel provides tools like T-tests, Chi-Square tests, and regression analysis, all readily accessible to perform these calculations. Understanding and correctly applying these methods ensures your statistical analyses are both robust and reliable.
What does a high p-value mean in my analysis?
+A high p-value (typically above 0.05) means there is not enough evidence to reject the null hypothesis, indicating that any observed differences could be due to random chance rather than a significant effect.
Can I calculate p-values for non-normal distributions in Excel?
+Excel primarily offers tests assuming normal distribution. For non-normal data, consider using specialized software or transforming your data to meet the normality assumption before analysis.
How does the type of tail (one-tailed or two-tailed) affect the p-value?
+A one-tailed test looks for an effect in one direction only, halving the critical region and thus typically yielding a larger p-value than a two-tailed test, which considers effects in both directions.


