Effortlessly Calculate P Values in Excel: Your Step-by-Step Guide

Calculating P values in Microsoft Excel can transform complex statistical analysis into a straightforward task, especially for those in research, academia, or business analytics where understanding significance levels is crucial. This guide will walk you through the process of calculating P values using Excel, ensuring you can quickly and confidently assess the statistical significance of your data.
Understanding P Values in Statistics
Before delving into the steps, it's essential to grasp what a P value represents. In statistics, the P value or probability value measures the evidence against a null hypothesis. Here’s a quick overview:
- Null Hypothesis (H0): Assumes no effect or relationship exists between variables.
- Alternative Hypothesis (Ha): Suggests that there is an effect or relationship.
- P Value: The probability of observing results as extreme or more extreme than what was observed, assuming the null hypothesis is true.
A small P value (typically ≤ 0.05) indicates that the data are unlikely under the null hypothesis, leading you to reject it in favor of the alternative hypothesis. Conversely, a larger P value suggests that the data align with the null hypothesis.
Here's how P values can be interpreted:
- P ≤ 0.05: Significant evidence against H0, generally leading to its rejection.
- P > 0.05: Insufficient evidence to reject H0.
The Tools You Need in Excel for P Value Calculation

To perform P value calculations in Excel, several key functions are at your disposal:
- T.DIST.2T: Calculates the two-tailed Student's t-distribution.
- T.INV: Returns the t-value of the Student's t-distribution for a given probability and degrees of freedom.
- F.DIST.RT: Computes the right-tailed F probability distribution.
- CHISQ.DIST.RT: Provides the one-tailed probability of the chi-squared distribution.
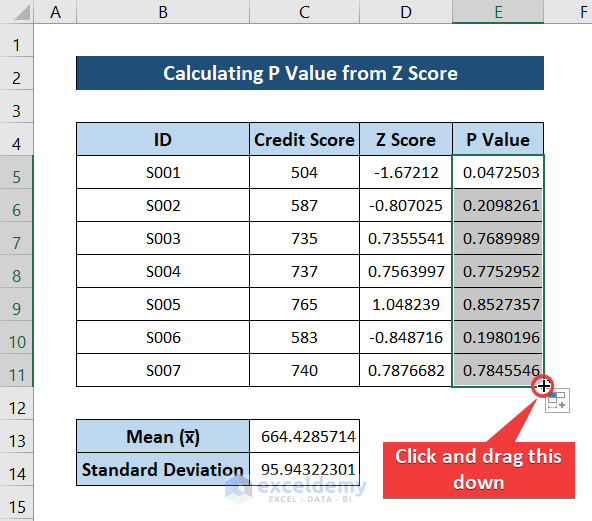
- Z.TEST: Calculates the P value for one-sample Z-tests.
- T.TEST: Performs a t-test between two sets of data to determine the likelihood of differences being due to chance.
Step-by-Step Guide to Calculate P Values in Excel
Let's dive into how to calculate P values with these Excel functions:
Example 1: T-Test for Independent Samples
If you're comparing two independent groups to see if their means differ significantly, use the T.TEST function. Here’s how:
- Select your data: Assume two columns, A and B, contain your sample data.
- Enter the function: In a blank cell, type:
=T.TEST(A2:A101, B2:B101, 2, 2)
This function uses:
- A2:A101: First data set range.
- B2:B101: Second data set range.
- 2: Two-tailed test (you can use 1 for one-tailed).
- 2: Indicates paired or not; here, set for independent samples (use 1 for paired).
🔍 Note: Always ensure your data is clean and appropriately formatted before performing statistical tests.
Example 2: One-Sample Z-Test
If you’re testing the significance of one sample's mean against a known population mean, the Z.TEST function is your tool. Here's the process:
- Prepare your data: Suppose your sample data is in A2:A101.
- Enter the formula: In a cell, type:
=Z.TEST(A2:A101, 50, 3)
- A2:A101: Range of your sample data.
- 50: The population mean you’re testing against.
- 3: The known standard deviation of the population.
Example 3: Chi-Square Test for Goodness of Fit
For testing observed frequencies against expected frequencies, you would use the CHISQ.DIST.RT function:
- Enter the observed frequencies: In column A, list observed frequencies (A2:A6).
- Enter the expected frequencies: In column B, list expected frequencies (B2:B6).
- Calculate chi-square statistic: In C2, enter:
=SUM((A2:A6-B2:B6)^2/B2:B6)
To get the P value, use:
=CHISQ.DIST.RT(C2, (COUNT(A2:A6)-1))
Key Points to Remember
- Always ensure your data meets the assumptions of the statistical test you’re using.
- P values do not measure the size or importance of an effect, only the probability of the observed data given the null hypothesis.
- Context is key; a significant P value might still be practically insignificant if the effect size is small.
Final Thoughts
By now, you've seen how Excel can be an invaluable tool for quickly calculating P values, which are essential for interpreting the significance of your data. Whether you’re dealing with t-tests, Z-tests, or chi-square tests, Excel provides robust functions to help you make informed decisions based on statistical evidence. Remember, the P value is just one part of a broader statistical analysis. It’s important to consider confidence intervals, effect sizes, and the practical implications of your findings for a comprehensive understanding of your results.
What does a P value tell you in Excel?
+A P value in Excel, or any statistical software, tells you the probability of obtaining test results at least as extreme as the observed results, assuming the null hypothesis is true.
Can Excel perform all types of statistical tests for P value calculation?
+Excel has built-in functions for many common tests like t-tests, Z-tests, and chi-square tests. However, for more complex or specialized tests, other software like R or SPSS might be more appropriate.
How accurate are P values calculated in Excel?
+The accuracy of P values in Excel depends on the assumptions of the test being correctly met and the quality of the input data. Excel’s functions provide robust results for standard statistical tests when used appropriately.


