Easily Calculate CAPM Alpha in Excel: Beginner's Guide

Capital Asset Pricing Model (CAPM) is a fundamental principle in finance that helps investors understand the expected return on an investment while considering its risk relative to the market. This guide will walk you through the simplest way to calculate the CAPM alpha in Microsoft Excel, a tool accessible to beginners and seasoned investors alike.
Understanding CAPM and Alpha
The CAPM is used to determine a theoretically appropriate required rate of return for an asset, helping investors make more informed decisions. Here’s a quick overview:
- Risk-Free Rate (Rf): The return of a theoretically risk-free investment.
- Market Risk Premium (Rm - Rf): The difference between the market’s expected return and the risk-free rate.
- Beta (β): Measures a security’s volatility compared to the market.
- Alpha (α): Represents the excess return of the investment over the return predicted by CAPM.
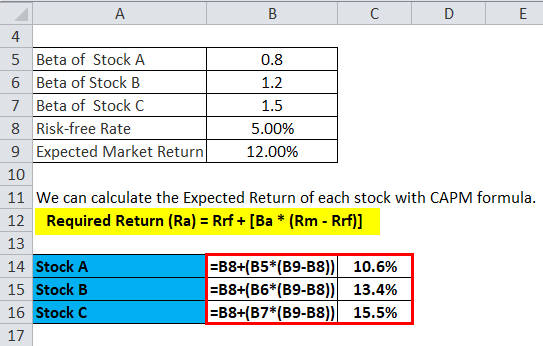
The formula for CAPM is: Expected Return = Rf + β * (Rm - Rf)
Preparing Your Excel Sheet
Before diving into calculations, you need to prepare your Excel sheet:
- Open Excel and create a new workbook.
- In the first column (A), list the following labels:
- Risk-Free Rate (Rf)
- Market Return (Rm)
- Beta (β)
- Expected Return
- Actual Return
- Alpha (α)
- Leave the adjacent cells in column B empty for data entry.
Inputting Data
Now, let’s input the necessary financial data:
- Risk-Free Rate: Enter the current yield of a government bond, typically the 10-year Treasury bond for the US market.
- Market Return: Use historical market data or forecasted returns.
- Beta: Either calculate this yourself using historical data or find it from financial websites.
- Actual Return: This is the return you’ve seen from the investment you’re analyzing.
Calculating Expected Return Using CAPM
In cell B4, enter the formula for the expected return:
=B1+B3*(B2-B1)📝 Note: This formula assumes cells B1, B2, and B3 have been entered with Rf, Rm, and β values respectively.
Calculating Alpha
Now, to find alpha:
- In cell B6, subtract the expected return from the actual return:
=B5-B4
This will give you the alpha value, which can be positive, negative, or zero:
- A positive alpha means the investment outperformed its expected return.
- A negative alpha indicates underperformance.
- An alpha of zero implies the investment met expectations exactly.
Interpreting Results
After performing the calculations:
- Review your alpha to see if your investment has generated excess returns.
- Consider these results alongside other metrics like Sharpe Ratio or Treynor Ratio for a broader performance assessment.
🔍 Note: Alpha alone isn't a complete measure of performance. Market conditions, time periods, and other risks can affect its reliability.
Additional Tips for Excel Analysis
- Formatting: Use appropriate formatting options to make your sheet visually appealing and easier to read.
- Error Checking: Ensure all formulas are correctly entered to avoid calculation errors.
- Conditional Formatting: Highlight cells based on positive or negative alpha for quick visual assessment.
This guide has provided you with a straightforward method to calculate CAPM alpha in Excel. Remember, while alpha can give insights into an investment's performance, it should not be used in isolation. Investors should combine this metric with other forms of analysis to make well-informed decisions. Utilizing Excel for such calculations helps demystify complex financial models, making investment analysis more accessible to all.
What does a negative alpha mean?
+A negative alpha means that the investment has underperformed compared to what CAPM predicted, indicating that the security has not provided adequate return for its level of risk.
How can I get beta for my investment?
+You can find beta by calculating the covariance of the investment’s return with market returns, dividing by the variance of the market. Alternatively, many financial websites provide beta values for publicly traded companies.
Is CAPM alpha a good indicator for stock selection?
+While CAPM alpha can be useful, it’s not sufficient alone for stock selection. It should be combined with other financial ratios, market analysis, and qualitative factors to make sound investment decisions.


