How to Calculate P-Value in Excel Easily

Introduction to P-Value
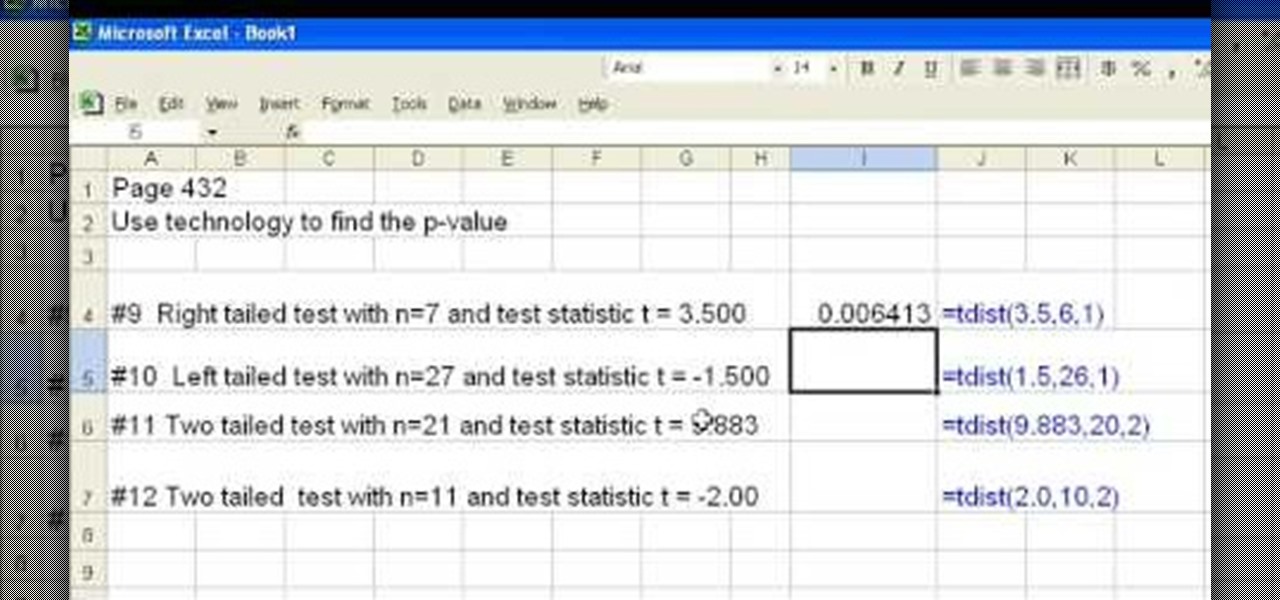
In statistics, understanding the P-value is crucial, especially when you are testing hypotheses. The P-value helps you determine the probability of obtaining your test results, assuming the null hypothesis is true. If this value is low (typically less than or equal to 0.05), it suggests that the observed effect is statistically significant, and you might reject the null hypothesis in favor of the alternative one. Calculating a P-value manually can be quite complex, but Microsoft Excel provides straightforward methods to calculate this statistic.
Understanding P-Value
Before diving into Excel’s methods for calculating P-values, it’s important to understand:
- Null Hypothesis (H0): This is a general statement or default position that there is no relationship between two measured phenomena or no association among groups.
- Alternative Hypothesis (H1): This is what you might believe if the null hypothesis is proven to be false. It could suggest the presence of an effect or a relationship.
- Test Statistic: A numerical summary of your sample data used to assess the null hypothesis. Common test statistics include t-statistics for t-tests or z-statistics for normal distribution tests.
P-value essentially measures how extreme the observed data is, assuming the null hypothesis is true. A small P-value indicates that your observed data would be unlikely if the null hypothesis were true, thus suggesting you can reject the null hypothesis.
Using T-Test for P-Value Calculation in Excel
One common method to calculate P-value in Excel is through the t-test, which is used when comparing the means of two groups:
Data Setup:
- Input your data sets into two columns in Excel. For example, Column A for Dataset 1 and Column B for Dataset 2.
T-Test Calculation:
- Click on an empty cell where you want the P-value to appear.
- Use the formula:
=T.TEST(array1, array2, tails, type)
- array1: Reference to the first dataset (e.g., A1:A10).
- array2: Reference to the second dataset (e.g., B1:B10).
- tails: The number of distribution tails. Use 1 for one-tailed test or 2 for two-tailed test.
- type: The type of t-test:
- 1 for paired
- 2 for two-sample equal variance
- 3 for two-sample unequal variance.
Here’s an example:
=T.TEST(A1:A10,B1:B10,2,2)
- Interpret the Result:
- The result will be a P-value. If this value is less than or equal to 0.05, you can reject the null hypothesis for a 95% confidence level.
🔍 Note: The t-test assumes that the data are normally distributed or the sample size is large enough for the Central Limit Theorem to apply.
Using Z-Test for P-Value Calculation
If your sample size is large or you are working with normal distribution data, a z-test might be appropriate:
Mean and Standard Deviation:
- Calculate the mean (x̄) and standard deviation (σ) for each dataset.
Z-Score Calculation:
- Use Excel’s formula:
=NORM.DIST(x̄-μ, σ/SQRT(n), TRUE, TRUE)
- x̄: Sample mean
- μ: Population mean (null hypothesis value)
- σ: Population standard deviation
- n: Sample size
- Convert Z-Score to P-Value:
- For a one-tailed test, you can use:
=1-NORM.DIST(z,0,1,TRUE)
- For a two-tailed test:
=2*(1-NORM.DIST(ABS(z),0,1,TRUE))
Notes on Hypothesis Testing in Excel
- Assumptions: Ensure your data meets the assumptions of the test you are performing. For t-tests, normality or large sample size, and equal variances (if using the equal variance t-test).
- Directionality: One-tailed tests look for an effect in one direction, while two-tailed tests consider both directions, making them less stringent to reject the null hypothesis.
In-Depth Analysis Techniques
For more complex scenarios or when dealing with multiple variables:
- ANOVA: Use this when comparing means of more than two groups. Excel’s Data Analysis ToolPak provides tools for ANOVA:
=ANOVA([Reference to your data range])
- Chi-Square Test: For categorical data, you can use:
=CHISQ.TEST(actual_range, expected_range)
- Correlation and Regression: These methods can also provide P-values, helping you assess the strength and significance of relationships between variables.

| Test | Excel Formula | Description |
|---|---|---|
| T-Test | =T.TEST(array1,array2,tails,type) | Compares means of two groups. |
| Z-Test | =NORM.DIST(z, mean, std_dev, cumulative) | Checks for significance with large samples or normal distribution. |
| ANOVA | Data Analysis ToolPak | Compares means among multiple groups. |
| Chi-Square Test | =CHISQ.TEST(actual, expected) | Tests for independence or goodness of fit in categorical data. |
This concludes the core of our guide on how to calculate P-values in Excel. When approaching hypothesis testing, remember that while Excel simplifies calculations, understanding your data’s distribution, selecting the appropriate test, and interpreting the results correctly remain crucial.
Summing up, the calculation of P-values in Excel can be approached in various ways, from simple t-tests to more advanced ANOVA or Chi-Square tests. Excel’s built-in functions make these calculations accessible, but careful consideration of the underlying statistical assumptions is still necessary for accurate interpretations.
What is the significance of a P-value?
+The P-value is a measure of the strength of evidence against the null hypothesis. It indicates how likely it is to observe the data if the null hypothesis were true. A small P-value (typically ≤ 0.05) suggests strong evidence against the null hypothesis, leading to its rejection in favor of the alternative hypothesis.
Can I use Excel for more complex statistical analysis?
+Excel is equipped with functions for basic to intermediate statistical analysis like t-tests, ANOVA, and regression. For very complex statistical modeling or large datasets, specialized statistical software like R, SPSS, or SAS might be more appropriate.
How do I ensure my data meets the assumptions for hypothesis testing?
+You should check for normality, homoscedasticity, and independence of observations. Use Excel’s functions like NORM.DIST, CHISQ.TEST, or visual tools like histograms, box plots, and scatter plots to verify these assumptions.
Related Terms:
- p value t test excel
- p value formula for excel
- excel correlation p value
- getting p value in excel
- p value in regression excel
- calculate significance level in excel


