5 Simple Steps for ANOVA Test in Excel

Understanding the variations within and between groups of data can be pivotal in numerous fields, from psychology and agriculture to business analytics. The Analysis of Variance (ANOVA) test is a statistical method used to compare the means of three or more samples to infer if at least one sample mean is significantly different from the others. Excel, a widely used tool for data analysis, offers a straightforward way to conduct ANOVA tests, making it accessible for users to analyze complex datasets with ease. This blog post will guide you through 5 Simple Steps for ANOVA Test in Excel.
Step 1: Organize Your Data
Before running an ANOVA test, ensuring your data is organized correctly is key:
- Label your columns: Each column should represent a different group or condition, and the first row should have headers or labels for each group.
- Check for data consistency: Ensure that all your data is in numerical format, and there are no blanks or text entries in your data ranges.

Step 2: Input Data and Run the ANOVA Tool
Follow these steps to input your data and run the ANOVA:
- Navigate to the Data tab in Excel.
- Click on Data Analysis. If you don’t see this option, you might need to enable the Analysis ToolPak add-in.
- Select ANOVA: Single Factor from the list of analysis tools.
- In the dialog box that appears:
- Select the Input Range, which includes your labeled columns.
- Ensure Labels in first row is checked if your data includes headers.
- Choose where you want the output to be placed - in a new worksheet or an existing one.
- Click OK to run the ANOVA test.
Step 3: Interpret the Output
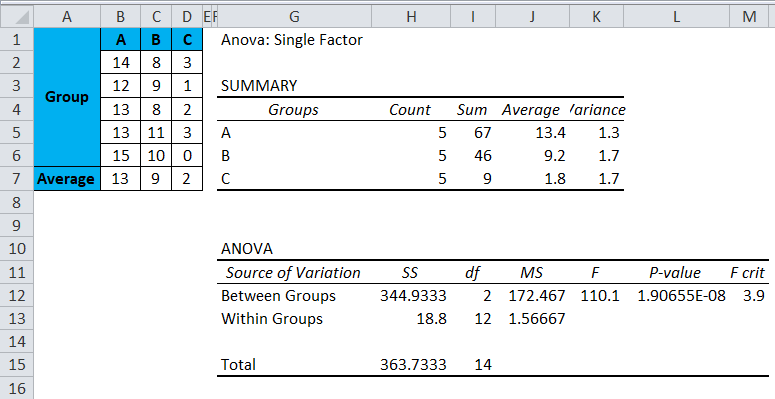
The ANOVA output in Excel provides several metrics, but here are the key ones:
- Summary Statistics: Gives an overview of each group’s mean, variance, and count.
- ANOVA Table: This contains:
- Between Groups: The variation attributed to different groups.
- Within Groups: The variation within each group.
- F: The ratio of between-group variance to within-group variance.
- p-value: If this value is below your significance level (commonly 0.05), you reject the null hypothesis, implying a significant difference exists between group means.
📊 Note: If you're conducting a one-way ANOVA, Excel only provides a single F-test for all groups combined. For a more detailed analysis, consider using additional tools or statistical software.
Step 4: Post Hoc Analysis
If your ANOVA test indicates significant differences:
- Excel doesn’t automatically perform post hoc tests, but you can manually perform these to identify which groups differ:
- Tukey’s HSD or Bonferroni correction are common methods, though you’ll need additional software or plugins for Excel to automate this process.
Step 5: Draw Conclusions and Next Steps
With the ANOVA results:
- Interpret the p-value to decide on the presence of significant differences.
- Consider the effect size to understand the practical significance of your findings.
- If significant differences are found, plan further investigation or post hoc analysis to pinpoint which groups are different.
By following these steps, you can effectively use Excel to perform ANOVA tests, analyze your data, and make informed decisions or recommendations. This method not only streamlines the analytical process but also enhances your ability to understand and communicate statistical findings.
What are the prerequisites for running an ANOVA test?
+The data should meet certain assumptions: independence of observations, normality, and homogeneity of variances among the groups.
Can I perform two-way ANOVA in Excel?
+Excel’s Analysis ToolPak provides the “ANOVA: Two-Factor With Replication” and “ANOVA: Two-Factor Without Replication” options for two-way ANOVA analysis.
How do I handle non-normal data when performing ANOVA?
+You can either transform your data to meet normality assumptions or use non-parametric alternatives like the Kruskal-Wallis test, which Excel does not support directly.
What does the F-value signify in ANOVA?
+The F-value represents the ratio of between-group variance to within-group variance. A higher F-value indicates that the means between groups are significantly different.
Is ANOVA sensitive to outliers?
+Yes, ANOVA can be sensitive to outliers. It’s important to check your data for outliers and consider their removal or use robust statistical methods.


