5 Easy Steps to Calculate Z-Score in Excel

Calculating Z-scores in Excel is a fundamental skill for statisticians, data analysts, and anyone who works with quantitative data. The Z-score is a statistical measure that expresses how far and in what direction an observation deviates from the mean, expressed in terms of standard deviation units. Understanding how to calculate it can provide insights into the relative standing of a value within a dataset. Here’s a comprehensive guide on how to compute Z-scores in Excel with 5 easy steps.
What is a Z-Score?
Before diving into Excel, let’s briefly define what a Z-score is:
- Definition: A Z-score (also known as a standard score) quantifies the number of standard deviations a data point is from the mean of a dataset.
- Formula: Z = (X - μ) / σ where:
- X is the value of the element
- μ is the mean of the dataset
- σ is the standard deviation of the dataset
The formula allows us to standardize data, making it easier to compare different datasets or observations within the same dataset.
Step 1: Organize Your Data
Ensure your data is well-organized in Excel. Here’s how:
- Place your data in a single column or row for consistency.
- Label the column or row appropriately for easier reference.

| Data Label | Data |
|---|---|
| A1 | 50 |
| A2 | 55 |
| A3 | 60 |
| A4 | … |
📚 Note: Make sure your dataset is complete and free of any outliers or data entry errors before calculating statistics.
Step 2: Calculate the Mean
Use Excel’s AVERAGE function to calculate the mean:
- Type the formula into an empty cell: =AVERAGE(range), replacing “range” with your data range, like A1:A10.
- Example: If your data is in cells A1 through A10, your formula would look like =AVERAGE(A1:A10).
Step 3: Compute the Standard Deviation
Now, calculate the standard deviation using STDEV.S or STDEV.P depending on your population sample:
- STDEV.S for a sample:
=STDEV.S(A1:A10) - STDEV.P for the entire population:
=STDEV.P(A1:A10)
Step 4: Apply the Z-Score Formula
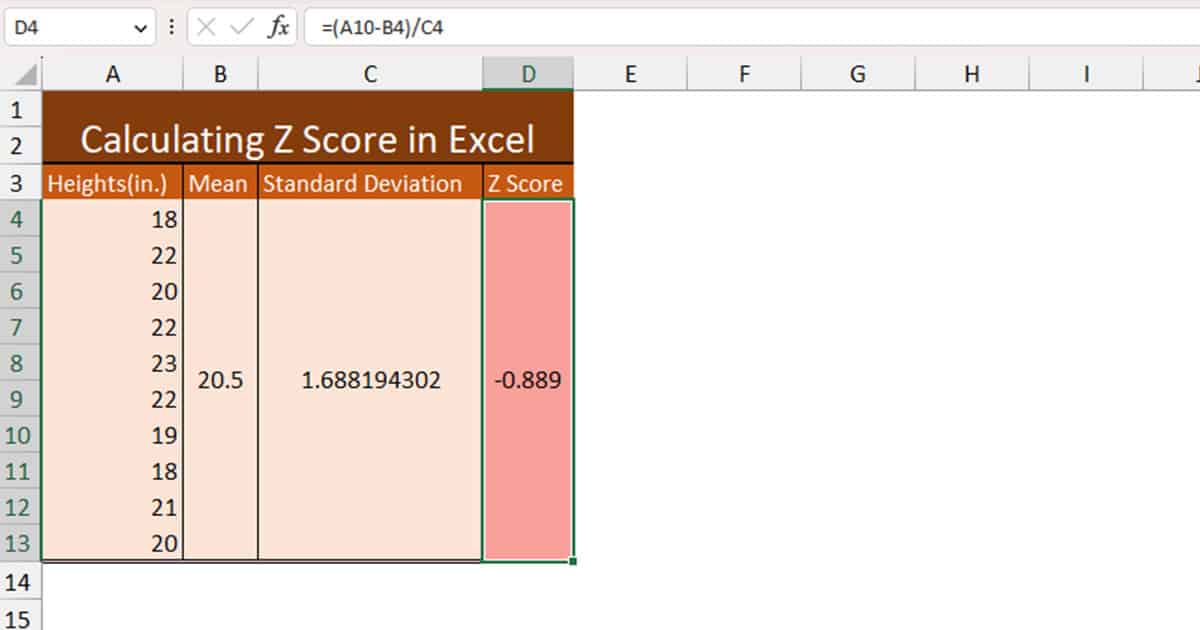
To compute the Z-score, you’ll use the formula mentioned earlier. Here’s how you can implement it in Excel:
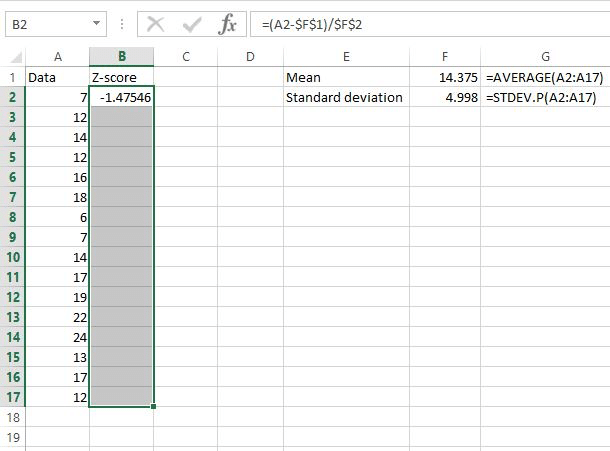
- For each data point, use the formula: =(A1 - AVERAGE(A1:A10)) / STDEV.S(A1:A10)
This formula can be copied and dragged down through the column to calculate Z-scores for all data points.
Step 5: Review and Interpret the Z-Scores
Once calculated, interpret your Z-scores:
- A Z-score of 0 means the data point is equal to the mean.
- A positive Z-score indicates the value is above the mean.
- A negative Z-score shows the value is below the mean.
- The absolute value of the Z-score tells how many standard deviations the data point is away from the mean.
👀 Note: Remember that the larger the absolute value of the Z-score, the more unusual the data point is relative to the dataset.
By following these five straightforward steps, you can calculate Z-scores in Excel, transforming raw data into a standardized form that is easier to analyze and interpret. The process of calculating Z-scores not only aids in understanding the distribution of data but also in identifying outliers or anomalies within your dataset. Remember, the practical utility of Z-scores extends beyond statistical analysis, helping in fields like finance, quality control, and educational assessments where comparison across different datasets is crucial.
Why is calculating Z-scores useful in Excel?
+Calculating Z-scores in Excel allows you to standardize data, compare different datasets, or observations within the same dataset, identify outliers, and assess the relative standing of values.
Can Z-scores be used for any type of data?
+Z-scores can be applied to any numerical data set where a mean and standard deviation can be calculated, making them versatile for various statistical analyses.
What’s the difference between STDEV.S and STDEV.P?
+STDEV.S calculates the standard deviation for a sample, which uses N-1 in the denominator to make it an unbiased estimator. STDEV.P calculates the standard deviation for the entire population, using N in the denominator.
Related Terms:
- probability from z score excel
- z test formula excel
- test statistic excel formula
- z score normalization excel
- example of z test
- find z score given area


