Mastering Data Normalization in Excel: A Simple Guide

Understanding Data Normalization
When working with datasets in Microsoft Excel, you often encounter a wide range of numbers. Some might be very small, while others could be in the millions. These differences in scale can complicate analysis, particularly when calculating means, variances, or when using algorithms sensitive to input magnitude. Data normalization is a technique that adjusts these values to a common scale without distorting differences in the ranges of values. In this guide, we’ll explore how to normalize data in Excel and why it’s beneficial.
Why Normalize Data?
- Comparability: Normalizing data allows for fair comparison across different variables that might otherwise be on vastly different scales.
- Data Analysis: Many statistical methods assume that the data is normally distributed or at least on a similar scale. Normalization helps meet these assumptions.
- Machine Learning: Algorithms like k-nearest neighbors, gradient descent, and neural networks benefit from normalized data as it can speed up learning and improve convergence.
- Noise Reduction: Sometimes, normalization can reduce noise by eliminating extreme values that might disproportionately affect your analysis.
Methods of Data Normalization in Excel
There are several ways to normalize data in Excel. Below, we’ll discuss the most common methods:
1. Z-Score Normalization
Z-Score or Standard Score normalization transforms data so that it has a mean of 0 and a standard deviation of 1. Here's how you can do it in Excel:
- Calculate the mean (AVERAGE) of your data.
- Find the standard deviation (STDEV.S or STDEV.P for sample or population data respectively).
- Use the formula
(value - mean) / standard deviationto convert each value into a Z-score.
🌟 Note: This method is useful when your data is normally distributed or when you want to compare datasets on different scales.
2. Min-Max Scaling
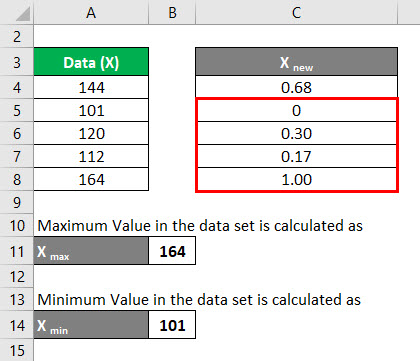
This method scales the data to a fixed range, usually between 0 and 1. The formula is:
(value - min) / (max - min)
- Identify the minimum and maximum values in your dataset.
- Apply the formula to each value.
3. Decimal Scaling
Here, we adjust the data by moving the decimal point. The idea is to shift the range of the numbers to [-1, 1].
value / 10n, where n is the smallest integer such that max(abs(x)) < 1
4. Log Transformation
Log transformation can be used when dealing with highly skewed data:
- Use LN(value) or LOG10(value) in Excel for logarithmic scaling.
🌟 Note: Remember to handle zeros or negative values appropriately, as they can cause issues in log transformations.
Implementing Normalization in Excel
Let's look at how you can apply these normalization techniques:
Example: Z-Score Normalization

| Original Data | Normalized (Z-Score) |
|---|---|
| 10 | = (A2-AVERAGE(A2:A6))/STDEV.S(A2:A6) |
| 20 | = (A3-AVERAGE(A2:A6))/STDEV.S(A2:A6) |
| 30 | = (A4-AVERAGE(A2:A6))/STDEV.S(A2:A6) |
| 40 | = (A5-AVERAGE(A2:A6))/STDEV.S(A2:A6) |
| 50 | = (A6-AVERAGE(A2:A6))/STDEV.S(A2:A6) |
Example: Min-Max Scaling
= (A2-MIN(A:A))/(MAX(A:A)-MIN(A:A))
When to Normalize?
Normalization isn’t always necessary:
- When your dataset’s range isn’t extreme, or you’re only interested in the rank order of the data.
- If you’re dealing with categorical variables.
- In situations where preserving the distribution or original scale is crucial.
To summarize, normalizing data in Excel involves several techniques tailored to your analysis needs. Whether you're applying Z-Score for standard comparison, Min-Max for a specific range, or even log transformations for skewed data, Excel provides the tools to manage these transformations efficiently. Remember to choose the normalization method based on your data's characteristics and the requirements of your analysis or model.
What is the difference between Z-Score normalization and Min-Max scaling?
+Z-Score normalization transforms data to have a mean of 0 and standard deviation of 1, making it ideal for data comparison. Min-Max scaling transforms data to fit within a predefined range, typically 0 to 1, which is useful when maintaining the original distribution isn’t necessary.
Can I use multiple normalization methods on the same dataset?
+Yes, you can apply multiple normalization techniques to different subsets of your data or use them sequentially for different purposes. However, be cautious as each method alters the data in its unique way, potentially affecting further analysis.
Is normalization necessary for every data analysis?
+Not always. Normalization is crucial when dealing with algorithms that require data on a common scale, comparing variables with different units, or when skewness affects statistical analysis. However, for rank order or categorical data, normalization might not be needed.


